Opensource BI / Dashboard / Reporting solutions?
-
Pentaho is another option. I have only used the ETL part but the suite is large
-
@dave_c said in Opensource BI / Dashboard / Reporting solutions?:
Pentaho is another option. I have only used the ETL part but the suite is large
Oh yeah, I was trying to think of that one.
-
ELK - ElasticDB search - Logstash - Kibana?
-
@xstorm said in Opensource BI / Dashboard / Reporting solutions?:
ELK - ElasticDB search - Logstash - Kibana?
Just the Kibana piece in that case, I think.
-
@dafyre said in Opensource BI / Dashboard / Reporting solutions?:
Is Grafana actually something that could work for you? If you're looking more for reporting, you could check out Jasper Reports.
Dashboards yes. You can do live reports with grafana within a certain time but a reporting tool might be better for reports specifically.
-
So I know I've looked at Grafana before, but now that I'm reading into it a bit more on lunch, I don't think Grafana is a BI tool.
Not in a sense that an accounting/sales team could use anyways. Maybe but it really looks more like an infrastructure monitoring and reporting tool to watch IT infrastructure.
-
@DustinB3403 said in Opensource BI / Dashboard / Reporting solutions?:
So I know I've looked at Grafana before, but now that I'm reading into it a bit more on lunch, this I don't think Grafana is a BI tool.
Not in a sense that an accounting/sales team could use anyways. Maybe but it really looks more like an infrastructure monitoring and reporting tool to watch IT infrastructure.
It will graph any time series data (even non time series but it's a little different). We used it for a lot at the last place I worked. We even used it as a dashboard for Graylog instead of using their own dashboarding. So anything you can log (as in collect data on) you can present.
-
@stacksofplates what sources were you feeding into it?
-
@DustinB3403 said in Opensource BI / Dashboard / Reporting solutions?:
@stacksofplates what sources were you feeding into it?
Mostly Elasticsearch, but you can feed quite a few different types of databases into it.
-
@DustinB3403 said in Opensource BI / Dashboard / Reporting solutions?:
So I know I've looked at Grafana before, but now that I'm reading into it a bit more on lunch, I don't think Grafana is a BI tool.
Not in a sense that an accounting/sales team could use anyways. Maybe but it really looks more like an infrastructure monitoring and reporting tool to watch IT infrastructure.
Yes, I found weird to find Grafana as an suggestion for cross tab reports created by non-technical users.
-
@dave_c said in Opensource BI / Dashboard / Reporting solutions?:
Yes, I found weird to find Grafana as an suggestion for cross tab reports created by non-technical users.
Yeah, what I saw for grafana was mostly heatmap, uptime, system performance type metrics.
Rather than the types of BI graphs one would expect from a Accounting/Sales teams which would show profit, costs, etc.
-
I forgot to mention the other big option along with Jasper and Pentaho: Spago BI now known as Knowage
Edit: going back to school so I can learn to type.
-
@DustinB3403 said in Opensource BI / Dashboard / Reporting solutions?:
@dave_c said in Opensource BI / Dashboard / Reporting solutions?:
Yes, I found weird to find Grafana as an suggestion for cross tab reports created by non-technical users.
Yeah, what I saw for grafana was mostly heatmap, uptime, system performance type metrics.
Rather than the types of BI graphs one would expect from a Accounting/Sales teams which would show profit, costs, etc.
I'm not going to keep harping on it. You guys can come to whatever conclusion you want. I specifically mentioned for dashboards
Dashboards yes. You can do live reports with grafana within a certain time but a reporting tool might be better for reports specifically.
And here's a tool that specifically holds data so you can use Power BI and Grafana together. https://panoply.io/integrations/grafana/power-bi/
-
@stacksofplates I'm not trying to harp, I'm just trying to understand how/where grafana would make sense. PowerBI (as awful as it is) seems to sell the potential more towards the Accounting/Sales team where as grafana specifically (and the community with it) seems to focus on Infrastructure graphing.
I've not deployed either personally nor do I have a reason too, I also saw the panoply site but didn't dig into it.
-
@DustinB3403 said in Opensource BI / Dashboard / Reporting solutions?:
@stacksofplates I'm not trying to harp, I'm just trying to understand how/where grafana would make sense. PowerBI (as awful as it is) seems to sell the potential more towards the Accounting/Sales team where as grafana specifically (and the community with it) seems to focus on Infrastructure graphing.
I've not deployed either personally nor do I have a reason too, I also saw the panoply site but didn't dig into it.
Yeah I mean Grafana is just a reporting tool. It will report literally anything you put into it. It's kind of like saying Jenkins is only a build tool. It does soo much more but some people only look at it that way.
-
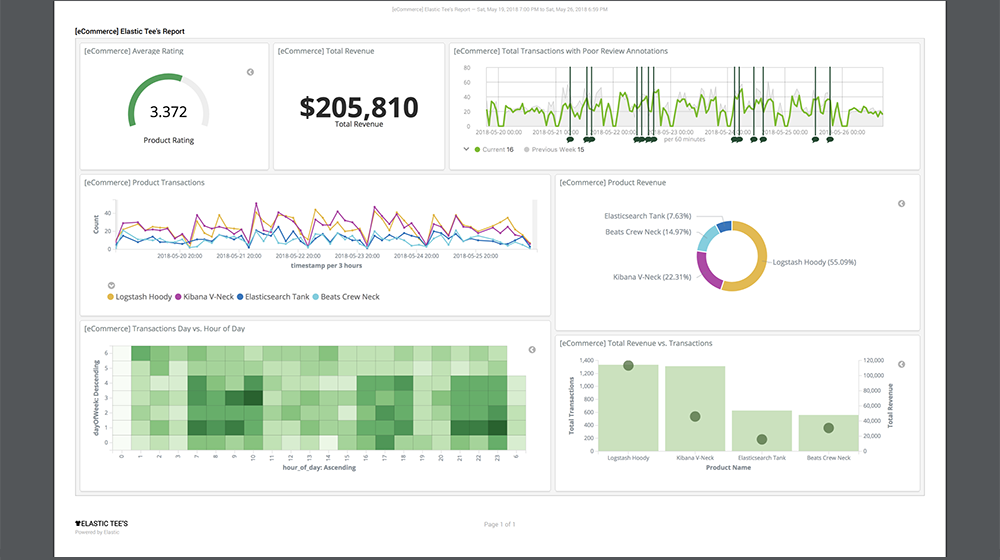
Obviously this is a stupid simple example, but I don't have any BI things to integrate with.

-
Here's another example in Kibana. You can pull the same data out and display in Grafana